What We Offer
Almost unlimited possibilities for collecting and analyzing company’s operating performance and financial results. Track and share your KPIs with your team in real time.
P&L in real time
Both your top and bottom line results will be automatically calculated taking into teh account all financial and operating activities of a company.
Data protectin on Microsoft servers
All data is stored on a cloud server with a multi-level protection.
Analytics on your fingertips
Management Accounting, P&L, Cash flow, Balance Sheet, Google Analytics, CRM, Warehouse, Sales Funnel - all indicators and analytics in one application.
Dynamic drill-down
You will be able to analyze all your sales and purchases, income and expenses, the effectiveness of employees and departments - for a day, week, month, year.
Personalized analytics capabilities.
Unique dashboard and analytical tools for each department or user. Restriction of access level for any categories or users.
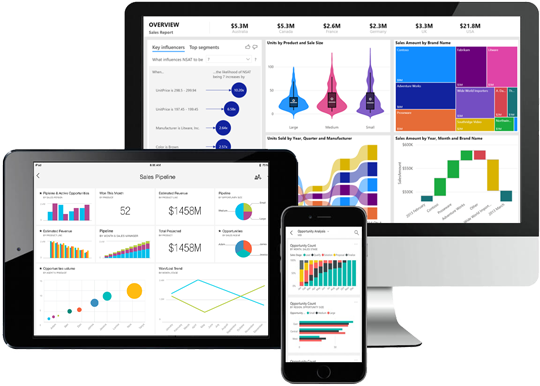
Intuitive and interactive interface
Thanks to hundreds of options for graphs and charts, you can customize the desired data visualization individually for each indicator.
BUSINESS INTELLIGENCE
BI
BI comprises the methods and tools for translating raw information into a meaningful, convenient form. BI technologies process large amounts of unstructured data to find strategic business opportunities. BI Analytics is an analytical system that combines data from various sources of information, processes them and provides a convenient interface for a comprehensive study and evaluation of the information received. A comprehensive analysis of data in all areas of the business can increase its efficiency and reduce costs. Thus, BI Analytics business analysis systems are a single transparent source of company business data for its management.
HOW OUR SYSTEM WORKS
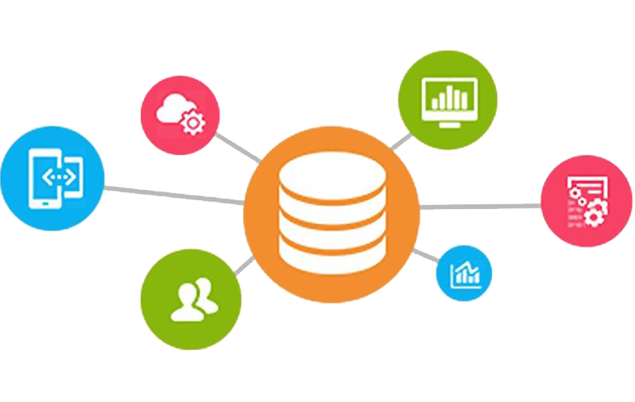
To start with, we audit a current system of input first and then we consolidate, streamline and structure a company data
BI processes, transforms and delivers data to end users
data is displayed on any device, in accordance with the pre-set access rights.

Interaction
Interact with colleagues and share both individual charts and complete reports.
WHOM BI IS FOR
Manager / Business Owner
Manage company metrics wherever you are.
Financial director
Meaningful financial planning and reporting structured in most user-friendly manner.
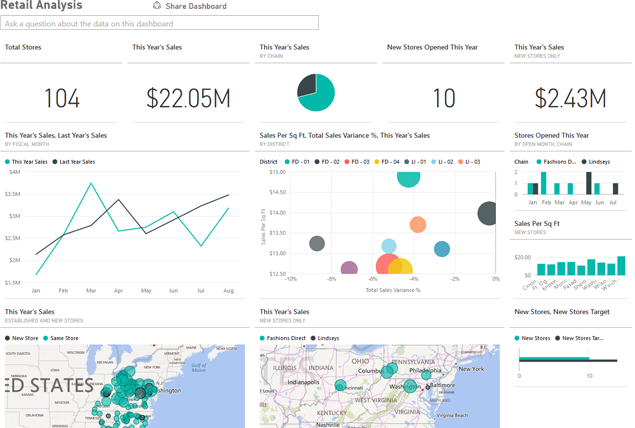
Sales director
It will now take minutes to build a sales report for managers, brands and stores by products, categories, segments, etc.
Marketing director
The marketing professionals can visualize, monitor and analyze the activities spanning from planning to execution.
Operacions director
Unparalleled ability to monitor the efficiencies of supply chain and inventory management, manufacturing and logistics.
HR director
Track KPIs and motivation system by seeing the entire organization on one screen. Manage the performance of each employee in any given period.